

 Shropshire, UK
Data Analysis

Assets:
SQL Code │ Tableau Visualisation │ Power BI Dashboard (PDF)
FullFast Fibre — The Background:
FullFast Fibre Broadband (FFF) is an ambitious challenger ISP based in the Midlands, UK.
The company is on a mission to bring full fibre broadband into people’s homes across the Midlands, while also unlocking the full potential of the communities they serve.
FullFast Fibre is committed to delivering high speed connectivity infrastructure to rural communities in the Midlands. The company is keen to level up the playing field for everybody, especially people living in the countryside. People living in rural communities have been underserved for many years by slow and unreliable copper-based broadband products.
The company’s full fibre network spans across eleven different Midlands counties. A wide range of broadband products are available to customers, from 20Mbps broadband through to dedicated 1Gbps FTTP services. Contracts are flexible and customers can choose between 12, 18, or 24 month contracts.
FullFast Fibre has an experienced Sales and Marketing department, consisting of 26 people. Each of the 12 Account Managers has a dedicated Marketing Executive who supports them day-to-day. The team is managed by two Directors.
The Marketing team has an annual budget of £2M which they leverage to drive sales for the company. The team regularly runs multi-faceted marketing campaigns combining a range of different activities, including: TV, Direct Mail, Email Marketing, Social Media, Radio, and much more!
Additionally, the Marketing team has a pot of funding available which they can use to provide discounts to certain customers. These discounts usually form part of campaigns, or are requested by the Account Managers, on an ad hoc basis, in order to get a deal over the line. Customers can get either one or two months free at the discretion of the team, but this eats into the ROMI on those deals.
Ask
While FullFast Fibre’s Sales and Marketing team excels when it comes to selling and promotions, the team has always struggled with reporting and campaign analysis.
Many of the Account Managers and Marketing Executives use individual spreadsheets to track their campaign performances and activity/budget spends.
The Marketing team then spends many hours each week moving their data across into a centralised spreadsheet which is owned by the Marketing Director.
This has become extremely time consuming for everybody involved and the data entry process is also susceptible to human-error.
FullFast Fibre hasn’t recruited enough data specialists in recent years, causing a skills shortage within the team.
That’s why I was approached to help the team to improve their data reporting processes.
The Sales Director wants to better understand:
- How many sales are being made each month, quarter, and year?
- How is the team performing against the same period the previous year?
- Which Account Managers are closing the most sales?
- Which broadband products are the most popular with customers?
- Which contract duration is the most popular choice among customers?
- Based on the number of serviceable properties on the FullFast Fibre network, what are the current sales penetration levels for each county served?
The Marketing Director wants to know:
- How much marketing budget has the team spent?
- What activities are we spending the most budget on?
- Which marketing activities are leading to the most amount of sales?
- What is the ROMI for each type of activity?
- What is the ROMI vs annual budget?
- How many discounts have been offered to customers?
Prepare
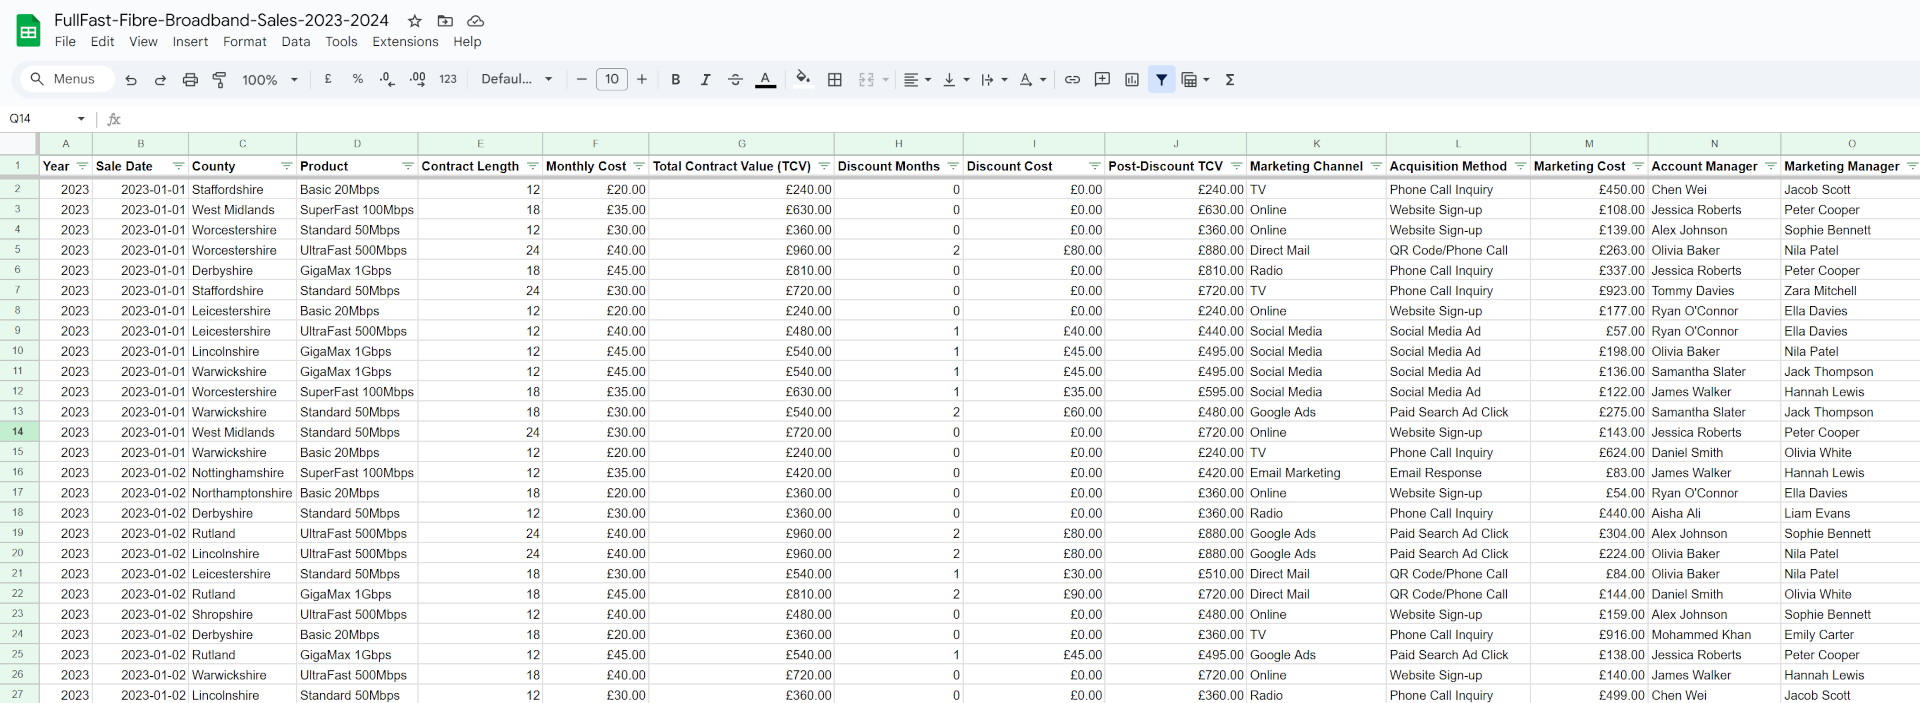
For the purposes of this project I generated my sales and marketing data randomly via a combination of AI and Python.
The Python script was constructed in two parts. The first section of code created the sales and marketing data for a two year period between 2023-2024, while the second worked out the sales penetration levels for each county on the network.
The code randomly selected the:
- Sales Date
- Account Manager
- Marketing Manager
- Midlands County (where the product was sold)
- Broadband Product
- Contract Length
- Marketing Acquisition Activity
- Marketing Cost
- Discount Provided
There were some restrictions built in to ensure the data replicated real-life as closely as possible. These included:
- Basing populations of counties on census figures.
- Keeping sales figures realistic based on the size of the ISP and commercial team.
- Making sure the network footprint wasn’t too large across each county in keeping with the ISP’s size.
- Ensuring sales penetration levels didn’t exceed the available footprint.
- Building in higher levels of conversion for certain activities, e.g. door knocking vs TV.
- Ensuring marketing costs scaled with activity types, e.g. direct mail being much cheaper than TV or Radio ads.
I then performed a small amount of data cleaning and filtering within Google Sheets before moving on to the data analysis stage.
Analysis
With my data generated, prepared, and cleaned, the next stage of my project was to begin analysing FullFast Fibre’s data to answer the key questions for the Sales and Marketing Directors.
I used Microsoft SQL Server and SSMS (SQL Server Management Studio 20) to write and run some simple SQL queries to answer my questions.

Results
Sales:
Overall:
FullFast Fibre made £3,991,230 TCV (Total Contract Value) in 2023 and improved TCV marginally the following year by 1.16%, bringing in £4,037,675 in TCV.
In 2023, FullFast Fibre sold 6,840 circuits to customers. Circuit sales were marginally improved the following year with 6,925 circults sold in 2024 by the team. That’s a sales percentage increase of 1.24%.
Daily performance:
Saturday was the busiest weekday for sales in 2023, with 1,019 sales made (14.9% of sales that year). £604,340 was generated on Saturdays throughout the year. Friday was the quietest day, with 937 sales made in 2023 (13.7% of sales). £542,885 was generated on Fridays.
The following year, in 2024, Monday was the busiest transactional day with 1,037 sales made (14.97% of sales made that year). But, Mondays didn’t generate the most income, that happened on Fridays where £612,120 was brought in by the team despite less circuits being sold. Wednesday was the slowest day for sales in 2024 with 951 circuits sold (13.73% of sales that year).
Monthly performance:
In 2023, July was the best performing month for sales with 605 circuits sold, representing 8.85% of the total sales made that year. £359,155 TCV was generated during July 2023. February was the worst performing month with 489 sales made (7.15% of the total sales made in 2023).
In 2024, October proved to be the best month for sales with 623 circuits sold (9% of the sales made that year). £366,490 in TCV was generated. In fact, October 2024 was the best performing month over the two year period. It was a good response from the Sales team because the previous month (September 2024) was the lowest month for sales with 543 made (7.84% of the total sales).
Quarterly performance:
The quarterly performance of FullFast Fibre was very even throughout 2024. Q1 proved to be the best performing quarter in 2024 with 1,767 sales made during that time (25.52% of annual sales in 2024). £1,028,095 TCV was generated in Q1 2024. This was the best quarterly performance over a two year-period. Q3 was the slowest quarter in 2024, but the team still sold 1,678 circuits (24.23% of total sales) and generated £984,400 TCV.
In the previous year, in 2023, it was the complete opposite! Q3 was the best quarter for sales with 1,734 circuits sold (£1,021,510 TCV generated), while Q1 was the worst performing quarter with 1,666 circuits sold (£970,075 TCV generated).
Sales by products:
During 2023, CFB’s UltraFast 500Mbps product proved to be the winner with customers. The team sold 1,402 circuits (accounting for 20.50% of the sales made that year) and the product generated £969,160 TCV. While the UltraFast 500Mbps product was most popular, it wasn’t CFB’s biggest earner.
GigaMax 1Gbps, the company’s fastest broadband product, was the fourth most popular product with 1,356 circuits sold, but due to the high £45 monthly rental charge, the product brought in £1,043,505 in TCV – the highest income per product in 2023.
The product trend in 2024, saw people move towards CFB’s slowest and cheapest broadband product – Basic 20Mbps. The team sold 1,430 Basic 20Mbps circuits in 2024, accounting for 20.65% of the sales made. This product generated £493,580 in TCV.
Again, GigaMax 1Gbps came bottom of the league for product sales by volume, but came out on top for income generated. The team sold 1,367 GigaMax 1Gbps circuits generating £1,056,285 in TCV. This represented 0.8% sales growth for this product, based on the PY sales.
Account Manager performance:
Mohammed Khan won the battle of the Account Managers in 2024, by bringing in £356,690 TCV via 603 circuit sales (8.71% of the total sales).
Mohammed narrowly outperformed Tommy Davies despite Tommy selling three more circuits than Mohammed with 606 circuits. Tommy brought in £351,245 TCV in 2024, which was £5,445 behind Mohammed’s total.
Samantha Slater finished bottom of the Account Manager table, with 542 sales made and £313,760 TCV generated. However, there was only a £42,930 difference between Samantha at the bottom of the table and Mohammed at the top!
Olivia Baker sold the most GigaMax 1Gbps circuits in 2024, with 127 units sold, generating £100,845 in TCV. But, Olivia wasn’t able to beat the record for GigaMax sales – this is still owned by Chen Wei, who sold 136 units in 2023, bringing in £105,435 in TCV.
The best year-on-year sales improvement came from Mohammed Khan. Mohammed improved his TCV by 12.35% in 2024 compared to the PY. That represented an increase of £39,210, from £317,480 in 2023 to £356,690 in 2024.
Several Account Managers sold less in 2024 than they did the PY, including:
- Alex Johnson
- Jessica Roberts
- Chen Wei
- Ryan O’Connor
- Daniel Smith
- Samantha Slater
- Aisha Ali
Alisha Ali’s sales performance dropped by the most in 2024 with a -8.76% swing. Alisha generated £30,655 less than she did the PY, from £349,805 in 2023 to £319,150 in 2024.
Sales by contract length:
During 2024, the shortest contract length – 12 months – proved to be the winner with customers with 2,322 sales made (or 33.53% of the total sales). 12 month deals brought in £884,290 of TCV.
24 month contracts – the longest – were the least popular with customers but generated the most income due to the longevity of the contracts (£1,799,910).
Sales by counties
CFB serves 11 counties in the Midlands across their full fibre network. In 2024, the most sales were made in the West Midlands (674), closely followed by Warwickshire (656) and Leicestershire (652).
Between 2023-2024, Leicestershire and Warwickshire were tied as the best performing counties for sales with a total of 1,299 sales made in both counties. Rutland came bottom of the league for sales in that time period (1,182), but it is worth noting that Rutland has by far the smallest full fibre footprint and is also the smallest county in England.
Worryingly, the West Midlands has the largest serviceable full fibre footprint on the CFB network, with 49,672 properties available to sell-in to, but with 1,251 sales made across 2023-24, the sales penetration rate for the county was just 2.52% – the lowest penetration rate by some distance.
Worcestershire and Shropshire had the highest sales penetration rates with 20% over a two-year-period.
Marketing:
Budget spend performance:
In 2023, the Marketing team spent £1,732,009 of their £2M budget on their deliverable activities, such as TV and Radio ads, plus a further £177,030 on subsidised discounts for customers, bringing the combined total spend to £1,909,039 (95.45% of the budget).
The following year, in 2024, the team had the same £2M budget to support the sales team. They spent £1,741,530 on all their marketing activities, plus a further £176,875 on customer discounts, bringing the combined total spend to £1,918,405 (95.9% of the budget).
Budget spend per marketing channel:
In 2024, the Marketing team spent over a quarter of their entire budget, £542,441 on TV adverts. This equated to 27.12% of the £2M budget.
But, this activity gave a very poor ROMI when it came to sales. That’s because the avg. cost per acquisition was £653.54. This high cost meant the ROMI was –7.33% or a 0.93:1 ROMI Ratio. That means for every pound spent on TV ads, CFB only received 93p in return, so a negative return and loss.
A 5:1 ratio is normally considered a strong return.
Radio adverts (£284,820 or 14.24% of budget) and door knocking (£222,018 or 11.10% of budget) were the second and third highest spend marketing activities.
Email Marketing was the lowest spend activity.
ROMI per marketing channel:
Email Marketing proved to be the strongest marketing activity for ROMI in 2024.
Promotional mailshots accounted for 3.79% of the total budget spend. Emails managed to drive 851 sales (12.28% of total sales) and £528,780 TCV. This resulted in an avg. cost per acquisition of £89.14 and 6.97:1 ROMI ratio. This means that for every pound spent on mailshots, FullFast Fibre earned £6.97 in return.
Online sales through the FullFast Fibre website was the second best performing channel. The website accounted for 889 sales (12.83% of the total sales) and generated £552,240 TCV. ROMI was 4.99:1.
As previously highlighted, TV proved to be the worst return on investment for the team.
Sales per marketing activity:
Door knocking led to the most number of sales in 2024, with 904 sales won. FullFast Fibre has various area management teams who door knock across the counties where network footprint is present.
TV yielded the least amount of sales with 830 in 2024.
The website provided the highest amount of TCV bringing in £552,240 in 2024. Direct Mail campaigns led to the least amount of TCV (£472,160).
Overall ROMI:
In 2024, with a total marketing spend of £1,918,405 and £4,037,675 TCV generated, this means the total ROMI was 110.47% or a ratio of 2.10:1 – meaning for every £1 spent, FullFast Fibre generated £2.10 in revenue.
Discounts to customers:
The Marketing Team handed out 3,481 separate discounts to customers in 2024 across 6,925 deals, which meant 50.26% of deals (or half) involved a one or two month’s free promotion. These discounts cost £176,875, totaling 8.84% of the annual marketing budget (£2M).
In terms of the month’s free promotions, 1,728 customers received one month’s free (49.64% of promotion deals), while 1,753 customers got two month’s free (50.35%).
3,444 customers bought their broadband deals in 2024 without a promotion applied.
Share
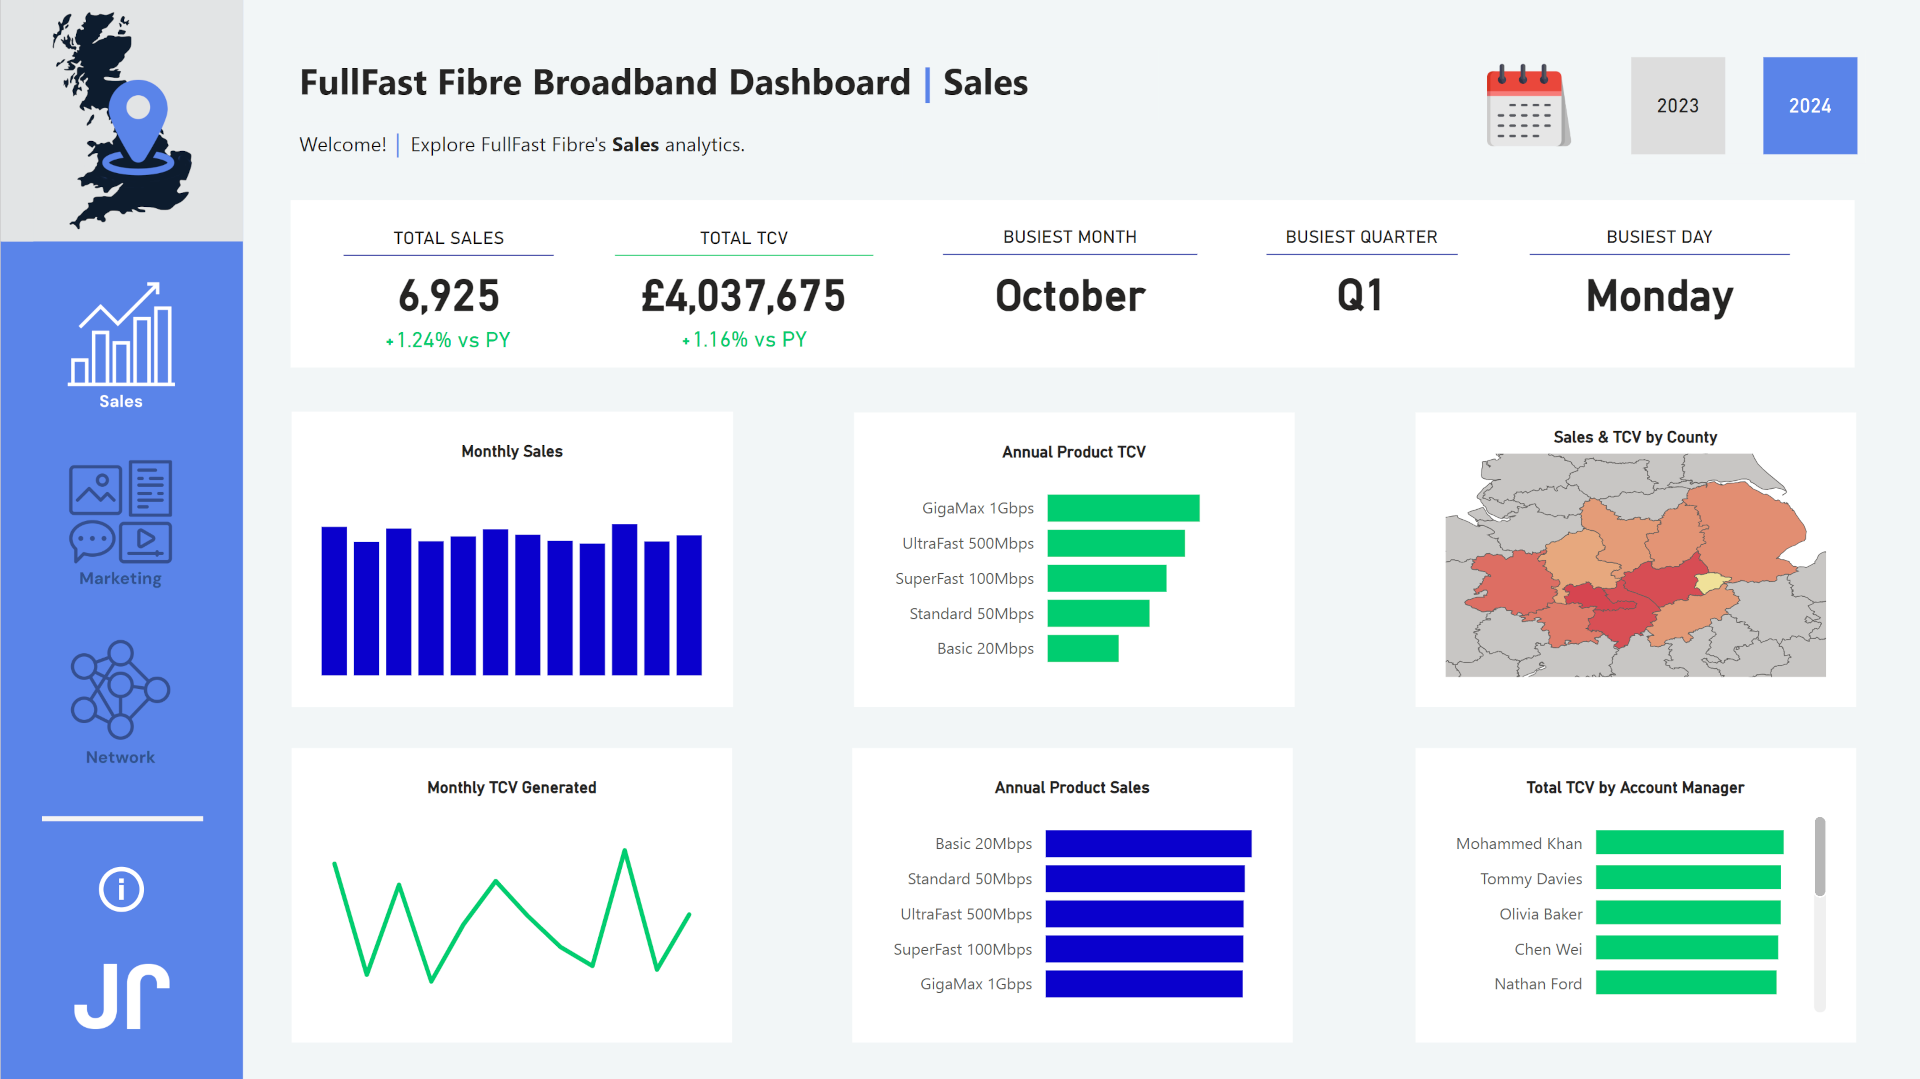
I used Tableau and Power BI to bring FullFast Fibre’s data to life, answer my key questions from stakeholders, and visualise the information in a clear and concise fashion.
Using a series of different charts and specialist techniques, I followed best practices to build the Tableau dashboard.
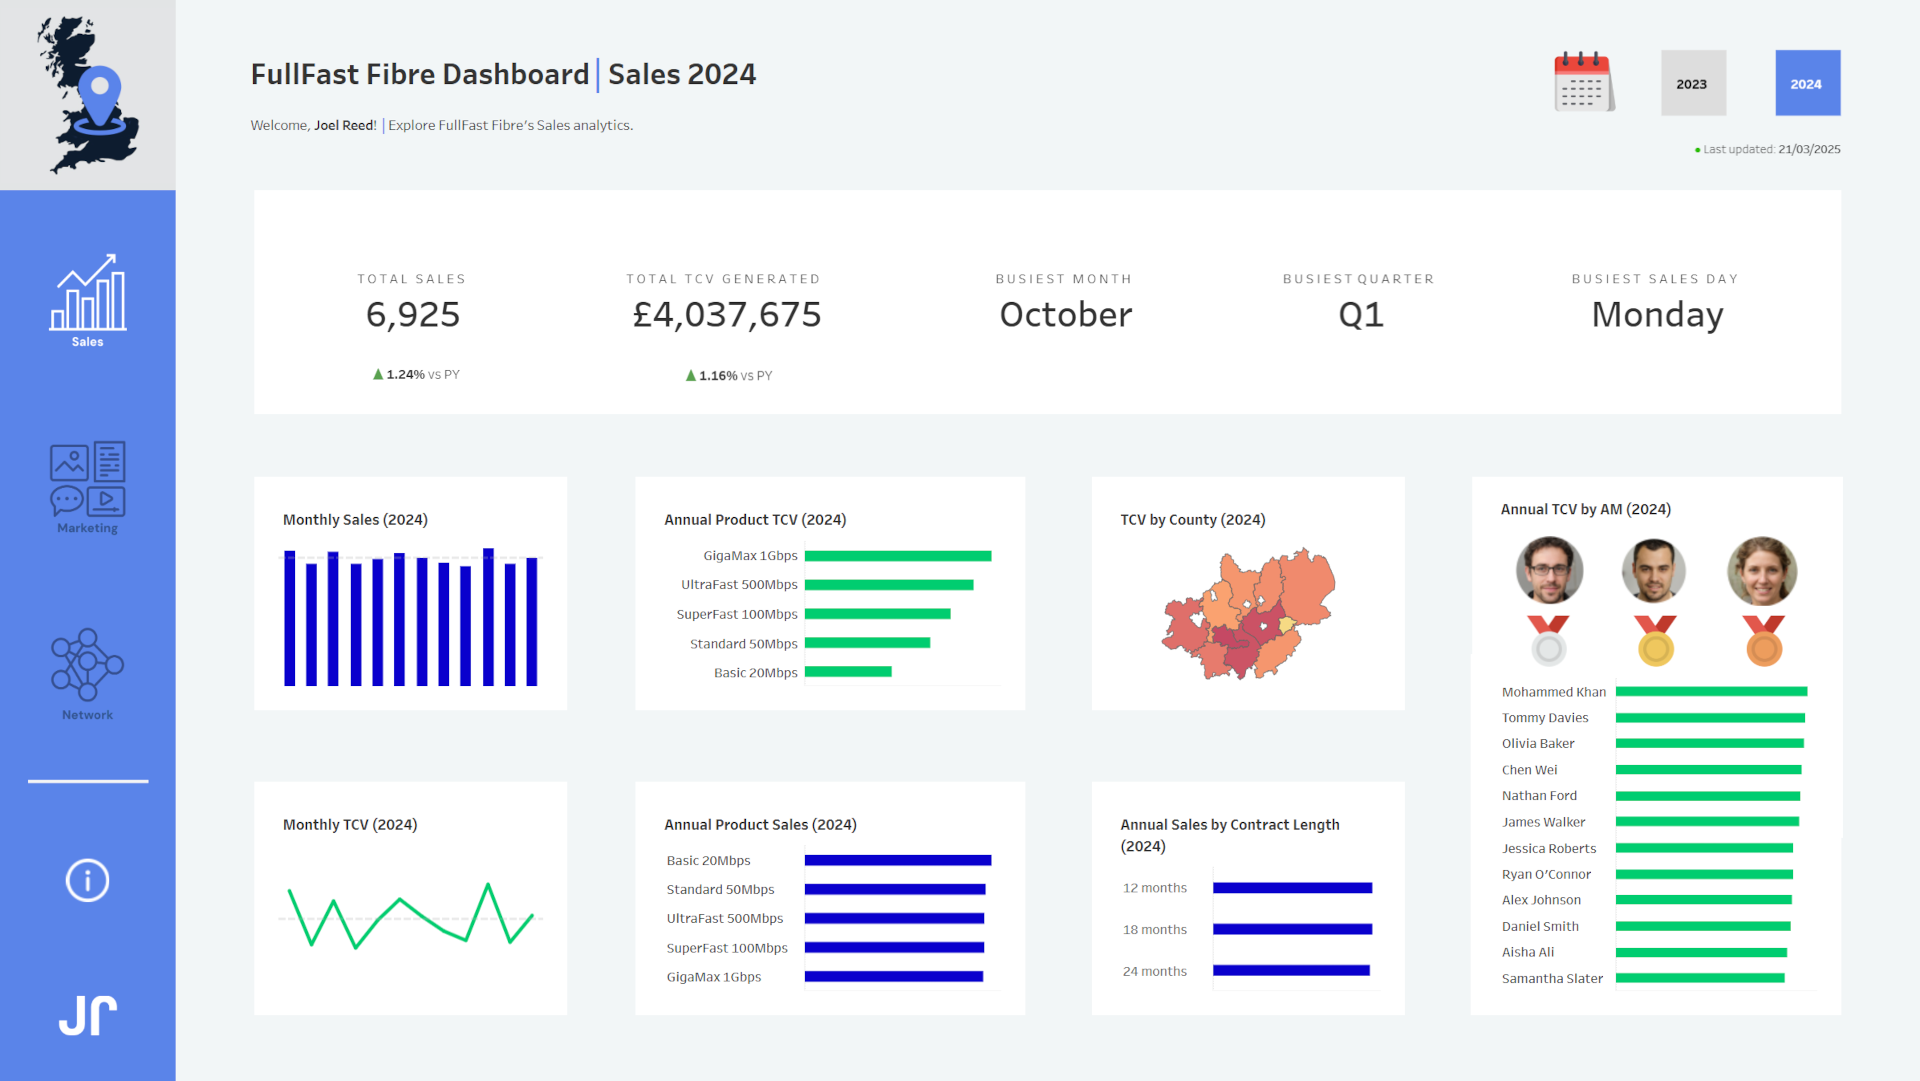
I then followed this up by building the dashboard like-for-like in Power BI.
Act (Recommendations):
- For 2025, I would recommend reducing the marketing budget for TV adverts considerably due to the losses that were made in 2024. By redirecting a quarter of the £2M budget into higher performing and cheaper activities, the team will be able to continue supporting sales while also improving their ROMI for 2025.
- During 2024, no customer discounts were provided via the FullFast Fibre website or as part of email marketing campaign activity. These two channels generated 24% of 2024’s total sales and provided £1,081,020 TCV. Providing tailored discounts on these digital channels will help to drive even more sales.
- The West Midlands has by far the largest full fibre footprint but the lowest sales penetration rate per county. Therefore, the Marketing team should focus efforts on driving sales in this county in 2025. Email Marketing was the most effective method of targeting sales when it came to ROMI, so this could be combined with other high-performing activities like Door Knocking.
- Direct Mail generated the least amount of TCV for the team in 2024. The Marketing team should focus their efforts on revisiting this collateral and working on new messaging, promotions and designs to attract even more customers in 2025. Something isn’t resonating with customers at the moment.
- The most revenue was generated online via the FullFast Fibre website. The Marketing team can continue to optimise the website moving forward, studying GA4 analytics to understand what is working and which pages need further optimisation. This should be balanced with Google Ads spending, which drove 860 sales in 2024, generating £477,175 TCV.
- Monday was the busiest day for transactions in 2024, but it was Fridays that drove the most TCV. The Marketing team could look to create weekend promotions, starting on Fridays, throughout the year to drive even more engagement.
- October 2024 proved to be the best trading month between 2023-2024. The Marketing team could look to launch a seasonal promotion, potentially for Halloween, in October 2025, to encourage sales.
- One in every five people bought FullFast Fibre’s lowest speed product – Basic 20Mbps – during 2024 and it was the highest selling product of the year. The lowest selling product in 2024 was FullFast Fibre’s GigaMax 1Gbps product – the fastest and most expensive bandwidth product available – but it contributed to the highest amount of TCV. In 2025, the Marketing team needs to focus their attention on driving more sales of the GigaMax 1Gbps product. This could include specialist discounts. One idea could be to offer three months’ free rental to the customer, extending the current longest promotion by one month. The team could also look to try and bring down the circuit price by £5 to see if this has a positive market effect.
- 12 month deals proved to be the winner with customers in 2024. The Commercial team could explore creating some even shorter-term contracts, such as six month deals, to see if these would attract more customers.
Data Limitations
Having worked in telecoms, I know how hard it can be to attribute a sale to a particular marketing activity. With my data, I had an activity mapped to each sale, but in reality this can be incredibly difficult to achieve, especially measuring through passive channels such as radio and TV. This data also didn’t factor in churn of customers, which is another project in itself.
Inspiration
While building my dashboard, I took huge inspiration from Priya Padham. My own dashboard tries to play homage to some of the techniques she has pioneered.

