Shropshire, UK
I’m British, so I’m used to getting soaked in the rain 😆☔
But have you ever wondered what rainfall looks like around the world? 🌍
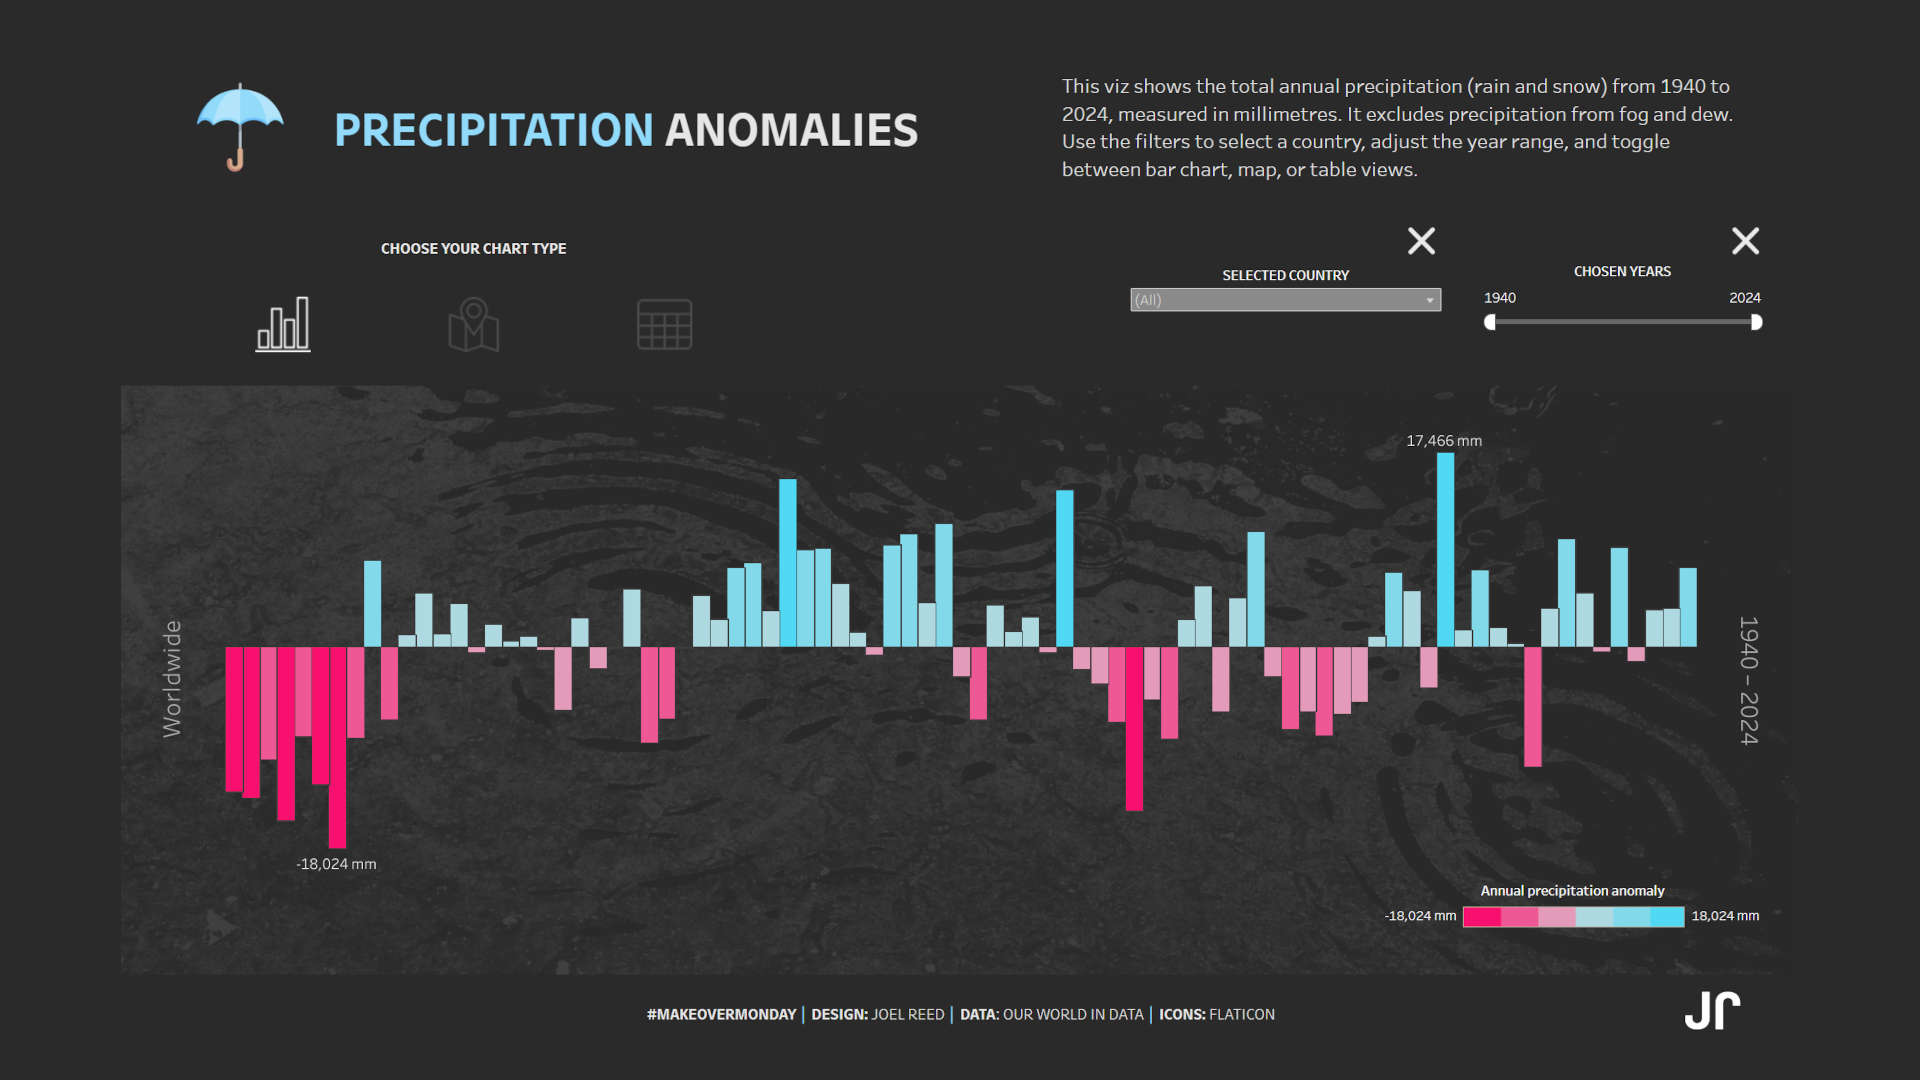
For this #MakeoverMonday challenge, I visualised 84 years of global precipitation (rain and snow), spanning from 1940 to 2024.
This viz was very difficult to put together and took tons of patience. 😡
I built a single interactive dashboard featuring maps, bar charts, and a sortable (and very stubborn!) table. While this viz tested my patience, I’m proud of how it turned out.
Dashboard
My final dashboard can be accessed here.

Written by Joel Reed. Read more of my blogs.