Shropshire, UK
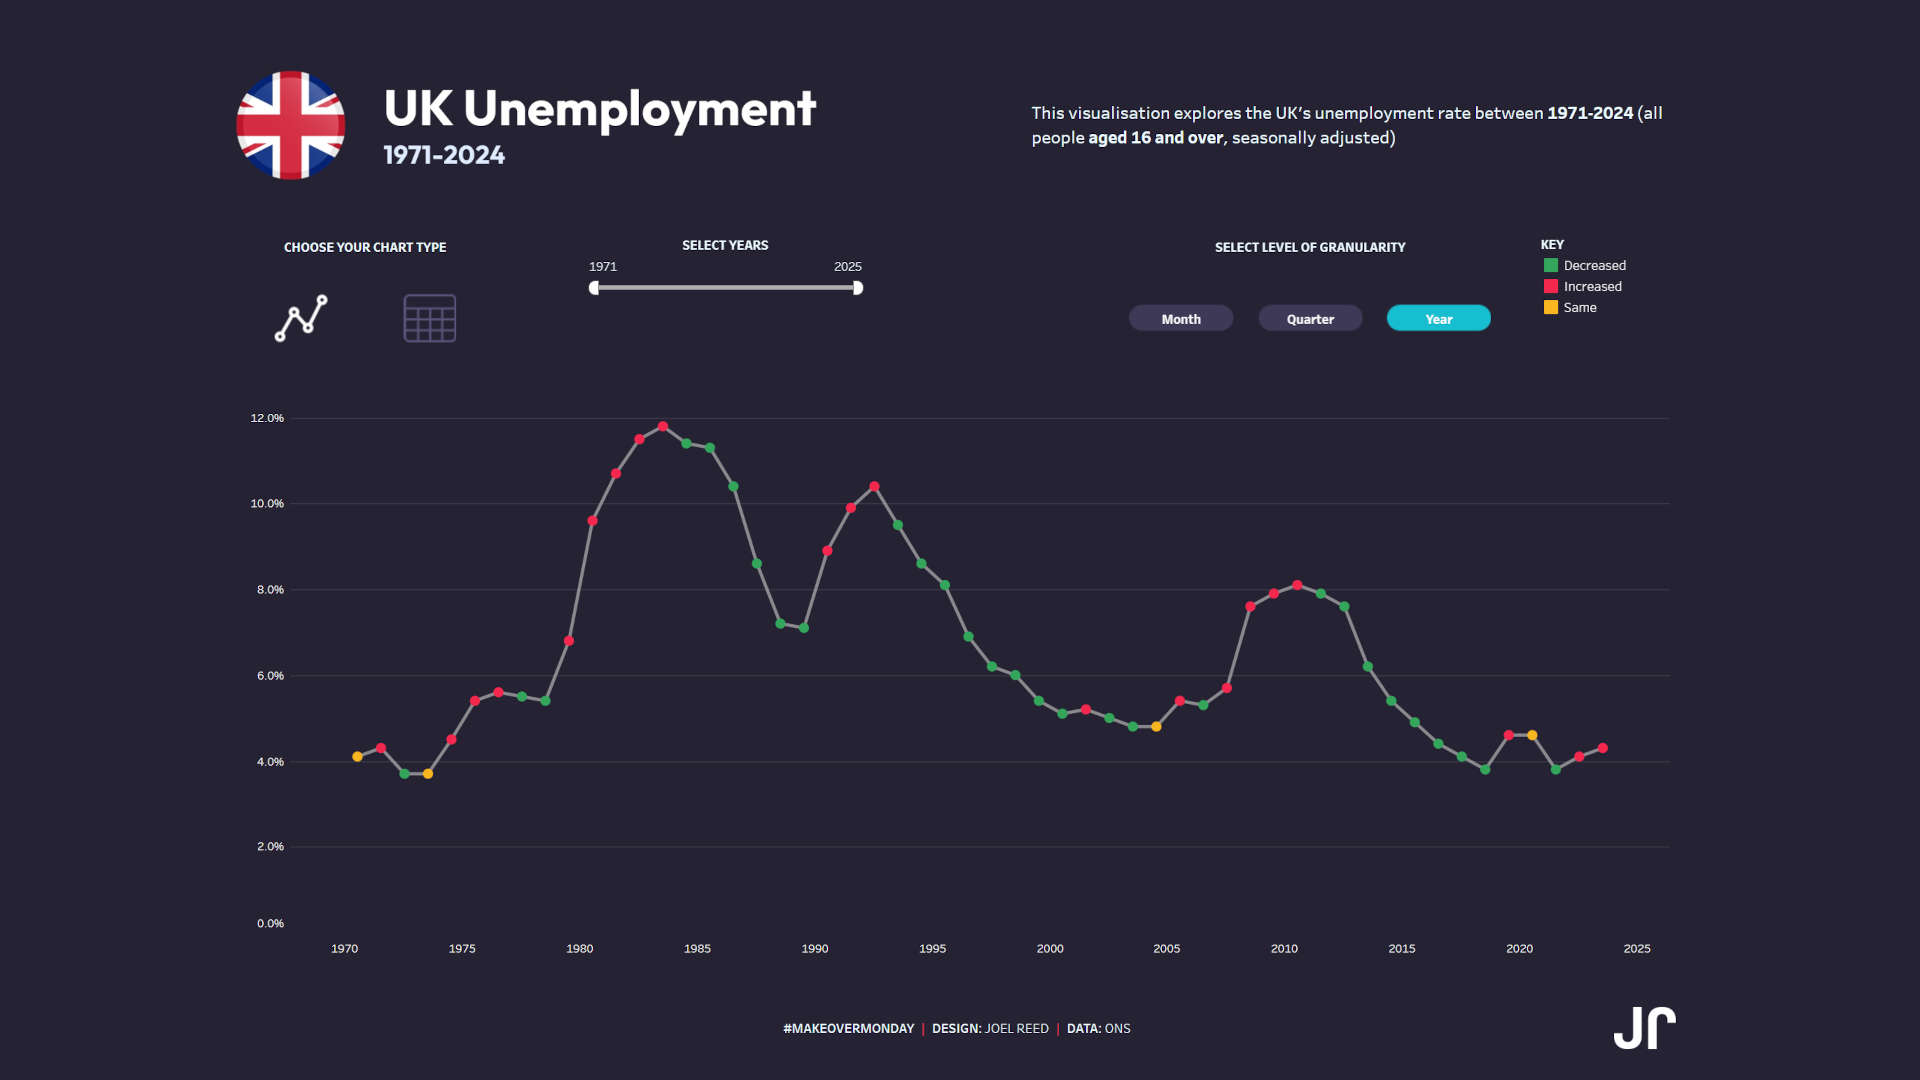
It’s a difficult time for millions of people across the UK, with unemployment at 4.3% 😔
Many talented people are searching for their next role in a challenging marketplace.
For this week’s #MakeoverMonday, I visualised 53 years of UK unemployment data.
Since the peak of 11.8% in 1984 under Thatcher, unemployment has been like a roller coaster for people in my country.
After a brief recovery post-pandemic, job numbers are sadly tumbling again.
But there’s always hope. 🌱
This build pushed my limits, but the results were worth it.
A line chart that highlights every peak and trough at a glance takes centre stage. With time toggles, users can seamlessly drill down into finer levels of detail.
For anyone looking for their next job in the UK, or overseas, I wish you good luck with your search ❤️
Dashboard
My final dashboard can be accessed here.

Written by Joel Reed. Read more of my blogs.